In addition to sharing our eTips across the social networks, you can subscribe to these essential marketing tips to keep you informed of emerging trends from print and PR to mobile and digital!
ETIP #51
Introduction to Google Analytics Visitors Flow
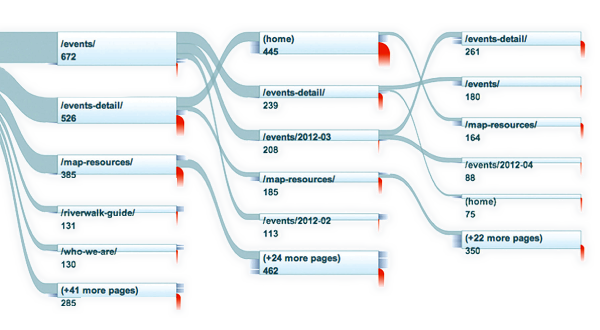
Traffic figures alone really don’t reveal much about what is going on with your website. “Flow Visualization” is a Google Analytics tool that allows you to analyze and optimize traffic flow on your website through graphs. This will help you better optimize your visitor experience by showing the ways that visitors use your website.
According to Google, “Nodes are automatically clustered according to an intelligence algorithm that groups together the most likely visitor flow through a site.” The Visitor Flow graph shows where visitors go and how they navigate page to page through your website and can be seen by traffic source and other dimensions. It can even show the path visitors take to exit your site. This type of visualization makes it much easier to segment user behavior and optimize the visitor experience.
Benefits include:
Analyzing Bounce Rate
Analyzing Exit Rate
Highly Interactive, can highlight different visitor pathways
You can find this visualizer in Google Analytics on the left hand navigation menu, where you’ll see a new “Visitors Flow” link under the Visitors section.